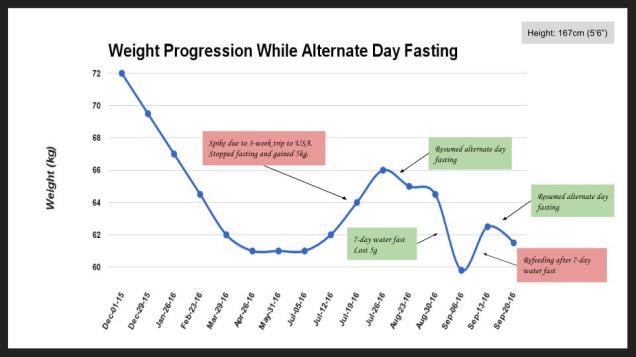
I thought it would be useful to put together a graph of my weight since I started alternate day fasting last December so I put together the chart below. I think it helps illustrate quite well how steady my weight loss was until I plateaued at what is most likely my “natural” weight. And then there was a huge spike up due to my 3-week trip to the US, where more calories were consumed than should be legally allowed, and a subsequent slight dip when I finally resumed alternate day fasting. Followed by a 5kg plunge when I completed my first 7-day water fast, which took me down to a weight (briefly) that I hadn’t seen since high school!
To put things in historical perspective:
- Graduated university – 62kg (Age: 23)
- Heaviest weight ever – 76kg (Age: 30)
- Subsequent lowest weight – 62kg (Age: 34)
- Fluctuated between 65kg and 73kg for the past 12 years (Ages: 34-45)
I am very much looking forward to seeing where I end up next January after the seasonal end of year festivities. If I manage to stay down at my natural weight, I may finally be able to declare an end to yo-yo dieting and put a check mark by that annual new year’s resolution that has eluded me for seemingly forever.